|
|||||||||
| Certiport PATHWAYS 2006 World Conference | |||||||||
EDC is pleased to join with Certiport in unveiling preliminary findings from the 2006 World Report on Digital Literacy. Like Certiport, EDC has projects that inspire sustainable change in countries around the world. We believe that learning is a liberating force in human development. Our programs and projects in education, health and human development bridge research and practice, pursue comprehensive solutions, and focus on questions that matter in people’s lives. Over the past 15 years we have been learning about the role technology plays in workforce and human development and we have developed a deeper understanding of the relationship between technology capacity, economic and political strength. The World Report on Digital Literacy brings us closer to understanding where we stand as a global community in our pursuit of opportunity in a global knowledge economy. Why was this report needed? Unlike other reports The World Report on Digital Literacy does not rely on “proxy” indicators. An example of a proxy indicator for digital literacy might be data mined from annual reports on the number of schools in secondary education with Internet connectivity. The Survey for this World Report on Digital literacy asked direct questions of policy makers and practitioners about the status and progress of Digital Literacy activities in their countries. The questions were designed to yield more specific and detailed information on digital literacy. For example: A representative of a country reports on a government mandate requiring all students in secondary education to complete a digital literacy course with content that is based on how students performed during an initial pre-assessment. This type and level of detail provides richer data that can be used to assess actual progress towards narrowing the Digital Divide. It provides a clearer picture as to the state of digital literacy among students in secondary education for this particular country. While the first example, used “indicators” that are straightforward in estimating the magnitude of ICT infrastructure, this use of indicators is too vague, too distant to be an authentic measure of digital literacy. The World Report on Digital Literacy meets this need for accuracy and depth. The survey questions were designed to yield information that would group nations in four categories in relation to policies and practices in addressing the Digital Divide. The categories form a continuum of mutually exclusive, progressive stages that range from awareness to accountability.
There was rigor attached to the study. Respondents were not simply asked if policies were in place or promising practices being used, they were asked to give specific, multiple examples such as names and dates that policies were enacted. The respondents sought out to participate in this study were people who had access to information on ICT infrastructure and digital literacy programs—making the data collected more reliable in providing an accurate and in depth picture of how each country is progressing in narrowing the Digital Divide. Who responded to this survey? 62 Countries participated in the 2006 Survey of Digital Literacy. Of those, 41 countries provided in-depth information that positioned them on a continuum of progress towards narrowing the Digital Divide. 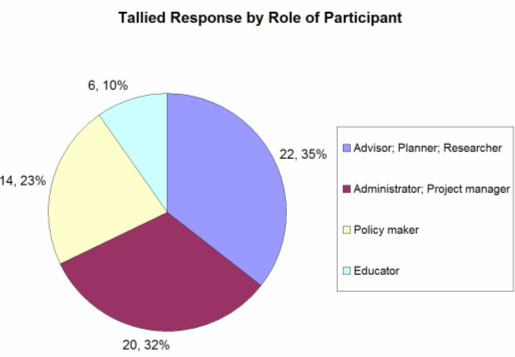 The chart above tells us that participants included a well balanced distribution of respondents including advisors/researchers, administrators/managers, policy makers and educators, with 33 percent (creme and teal colors) indicating policy makers who can legislate immediate responses to the digital literacy concerns, and educators, who influence long-term change. 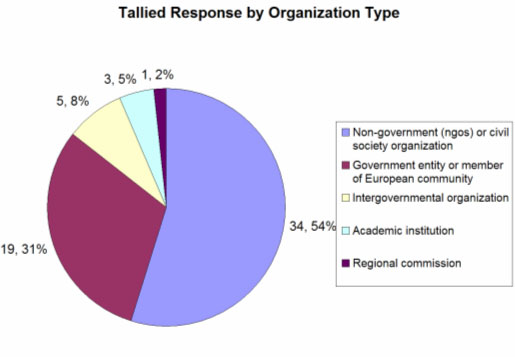 The chart above shows responses by organizational type and tells us that 31 percent came from government, 54 percent from non-governmental organizations, with smaller percentages from intergovernmental organizations, academic institutions and regional commissions. The fact that the majority—34 countries comprising 54 percent of participants come from non-government organizations—leads us to believe that their responses are authentic in reflecting the actual state of the Digital Divide as it is occurring “on the ground” in their home countries. 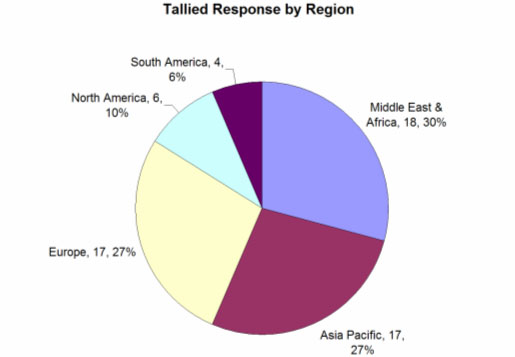 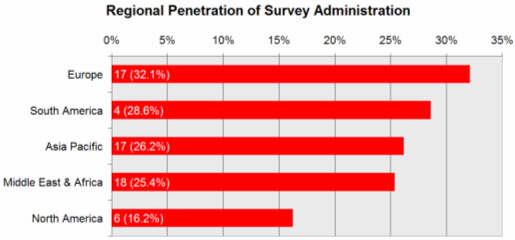 These penetration graphs indicate the percent of countries within each region that responded to the survey. 18 or 33 percent were from the Middle East and Africa, 17 or 27 percent from Asia Pacific region, another 27 percent from Europe, with 6 or 10 percent from North America, and 4 or 6 percent from South America. The chart at the bottom tells us that these respondents represented 32 percent of the European countries, 29 percent of South American countries, 26 percent of Asia Pacific, 25 percent of Middle East and Africa, and 16 percent of North American Countries. The question then remains: What did we learn? How did countries fall within the continuum of digital literacy? How do various regions of the world compare? Where does digital literacy rank among each country’s priorities? And what major findings emerged? Let’s take a look. 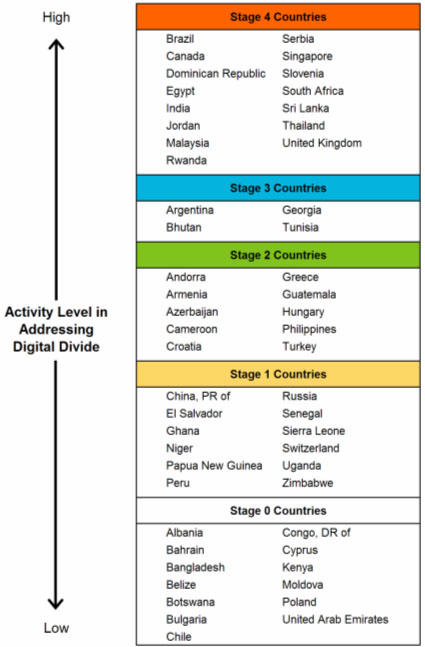 Beginning at the bottom and working our way up: Some countries are at Stage 0. These are not acknowledging that the Digital Divide is an issue. Stage 1 is the awareness stage: Governments acknowledge that the Digital Divide is a real issue. They may have developed a specific policy or commissioned studies on the topic. At Stage 2 governments make addressing the Digital Divide a national priority. These countries may have provided a budget to support activities, assigned specific tasks to committees and developed action plans. Stage 3 is the action stage where countries are actively involved in implementing strategies to narrow the Digital Divide; their focus is on infrastructure or human capital. The scale of activity may be at the city, province or national level. These countries may be at various stages of implementing their plan. Stage 4 is defined by accountability. Governments have made overcoming the Digital Divide a national priority, they have developed and are implementing action plans and are focused on monitoring and evaluating progress towards narrowing the Digital Divide. 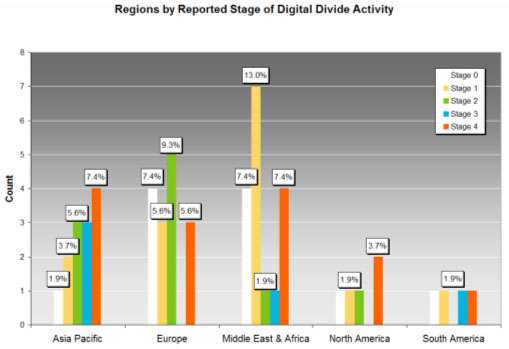 If we group by region, we can see Asia Pacific is, for the most part, characterized as “Stage 4,” Europe as “Stage 2,” Middle East and Africa as “Stage 2” (with a noteworthy representation of “Stage 4”), North America as “Stage 4,” and South America is undefined. Participants were asked to indicate, in their best judgment, how their government would likely rank 12 distinct issues, common to many countries, in terms of highest-to-lowest priority. A second survey question then asked participants where digital literacy (a 13th issue) is positioned in regard to rank among the 12 issues previously ranked. Responses were gathered from 29 countries. We wanted to see how much of a priority digital literacy is relative to the other priorities that their governments have established. The proportion of countries that responded to this survey question is represented by the Green slice in the pie chart. 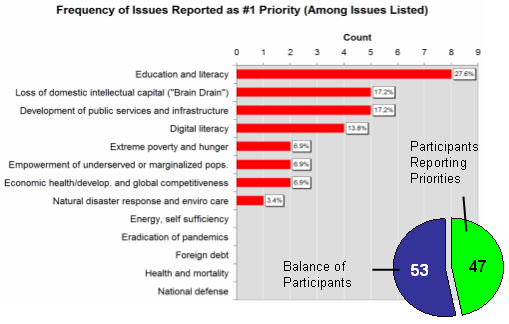 The bar graph shows a frequency distribution of the number one priorities reported. As seen, eight of the 13 issues listed were ranked as the top priority (shown as the Red bars). Digital literacy was the number one priority for four of the 29 (13.8 percent) countries that responded to this survey question, becoming the fourth top priority overall. Also worthy of mention is the fact that the top three issues listed here, namely “Education and Literacy,” “Brain Drain,” and “Development of Public Services and Infrastructure,” clustered closely with each other and with “Digital Literacy” in terms of proximity of where respondents ranked these issues. This clustering effect shouldn’t come as a surprise since one can intuitively see how these separate issues are connected. 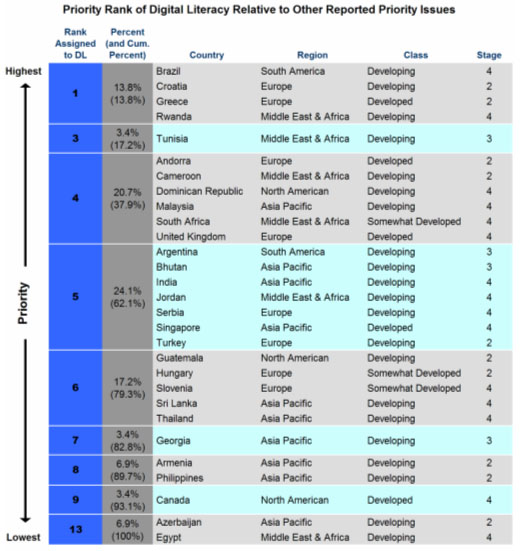 This table gives a breakdown, by country, of how digital literacy was ranked relative to the other reported priorities featured on the list of 12 issues. The blue column lists the rank assigned to digital literacy by participating countries. As you look across the rows you see the country name, its region, its development classification, and its stage along the digital literacy continuum. The most compelling part of this chart, however, is to see the cumulative percentages listed in the grey column. Four countries or 13.8 percent ranked digital literacy as their number one priority. If we move down this grey column, we see that 37.9 percent of the countries surveyed identified digital literacy among their top four national priorities. As we move down further, we see that 62 percent of countries survey identified digital literacy among their top 5 national priorities. When we consider the list of priority items on the previous chart we can only begin to understand the importance that countries around the world are placing on the importance of digital literacy in helping their countries move forward in the global knowledge economy. What did we learn? Countries that are more ICT diffused were generally more eager to share details regarding their own initiatives to reduce the Digital Divide. This graph compares the types of responses in this study to ICT Diffusion as defined by the Index of the 2005 UN Report. First we found that countries with less access to ICTs provided more detailed information on this study. 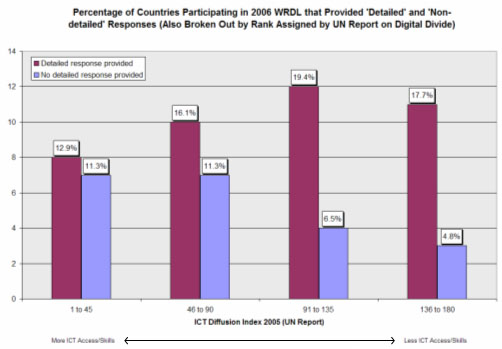 This is an important finding because the depth of responses from these countries confirms a sense of urgency among developing countries to address—no—to confront the Digital Divide. The details in their responses tells us that they are moving toward solutions that will set their country on a fast technology track that enables them to compete and succeed in a global knowledge economy. So what do we take away from these preliminary findings?
We look forward to the next phases of this research and reporting results to you at the next Pathways Conference. Adapted from Aug. 5, 2006 PATHWAYS Awards Gala.
|
|
||||||||

